
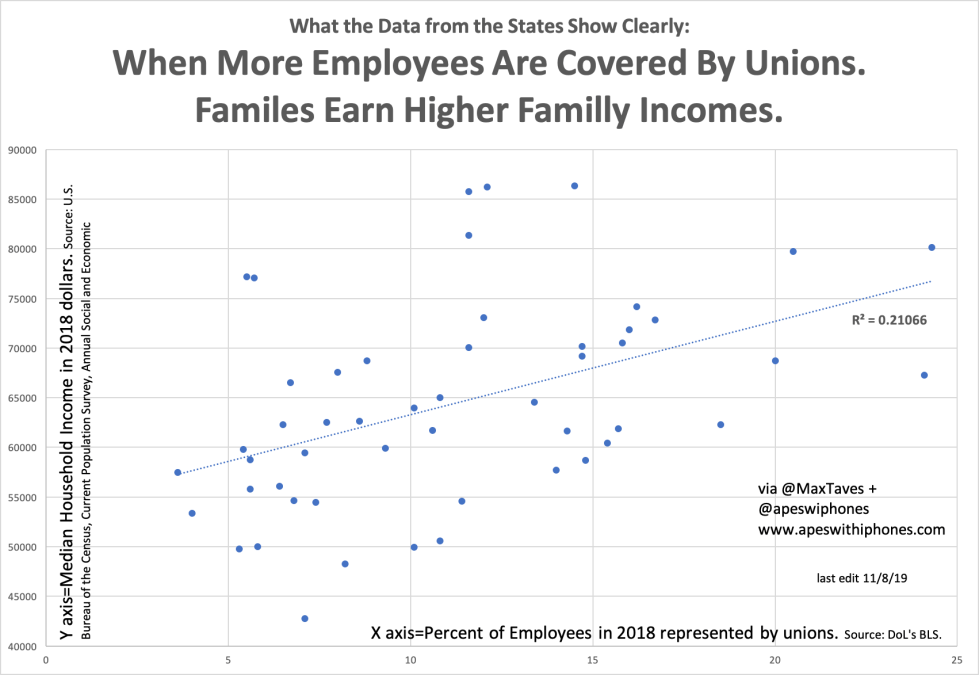
Read the chart. It should speak for itself.
I bring data to the convo. No point arguing about subject without seeing the numbers. Here they are.
The correlation is significant. R-squared value shown.
For additional background, see my previous post. Link here.

You must be logged in to post a comment.